The first release of a new development project consists entirely of added functionality. After that, each release usually consists of added functionality and changes to existing functionality. Care must be taken in deciding what is an add vs. a change. For example, if your application allows you to store information on sales people and you update it to capture information regarding products, then that is added functionality. If you capture information about your sales people without their birthdays but decide to begin capturing birth days, that is a change to the elementary processes associated with maintaining information on sales people. There was probably a user story like “as a manager, I can maintain information on my sales people.” An estimator would have identified elementary processes for adding sales person information, changing sales person information, deleting sales person information and displaying sales person information.
In subsequent releases after the first one, function points are still the best way to measure project size for functionality being added. Releases after the first release, but prior to the minimum viable product (MVP), tend to be made up primarily of added functionality. All of the rules discussed in Calculating the Size of the First Release are applicable here. Some care must be taken when adding data groups. Sometimes a data group will appear to be new but will be, in fact, part of an existing data group. For example, if an application might already have data groups for resources, i.e. people, and projects. If this release is introducing assignments, the question is whether this is a new data group. If the assignments are simply a relationship between people and projects, then it should probably be treated as a change to both of these existing data groups. It should be evaluated using SNAP points. If an assignment can exist independently of any project, then it is probably a separate data group that is being added at this time. It is added using function points. If neither of these extremes is the case, then it is the estimator’s job to decide whether it is new or change functionality and handle it accordingly.
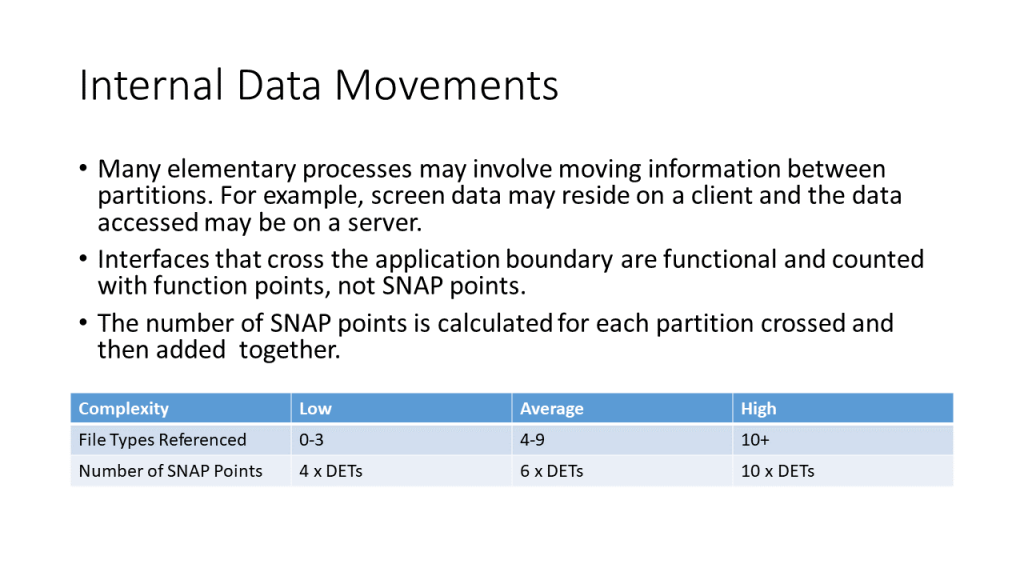
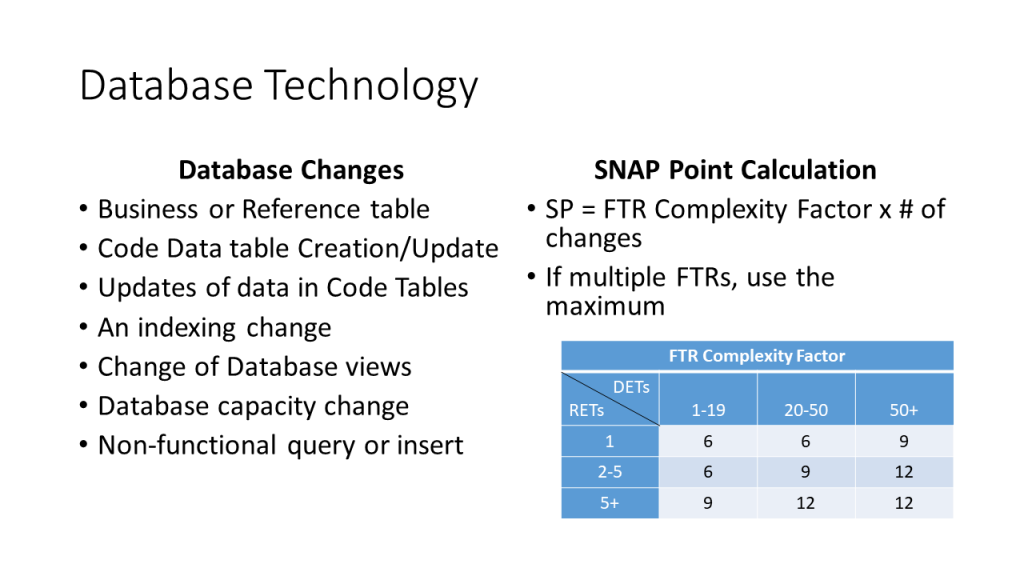
When counting SNAP points, begin by identifying the elementary processes that will undergo change. This process may begin by identifying the user stories that will change. These stories will have elementary processes associated with them. It is possible that some of the elementary processes associated with a changed user stories will not change. For example, there may be a story such as “as a manager, I can maintain employee information.” This story might have elementary processes to add, change, delete and list employee information. Even if the user story changes, it is possible that the “delete employee information” process will remain unchanged. Once the set of elementary processes that are changing is identified, use the rules that were described in Changing an Elementary Process to size the changes in SNAP points. The guidelines are repeated here for convenience:
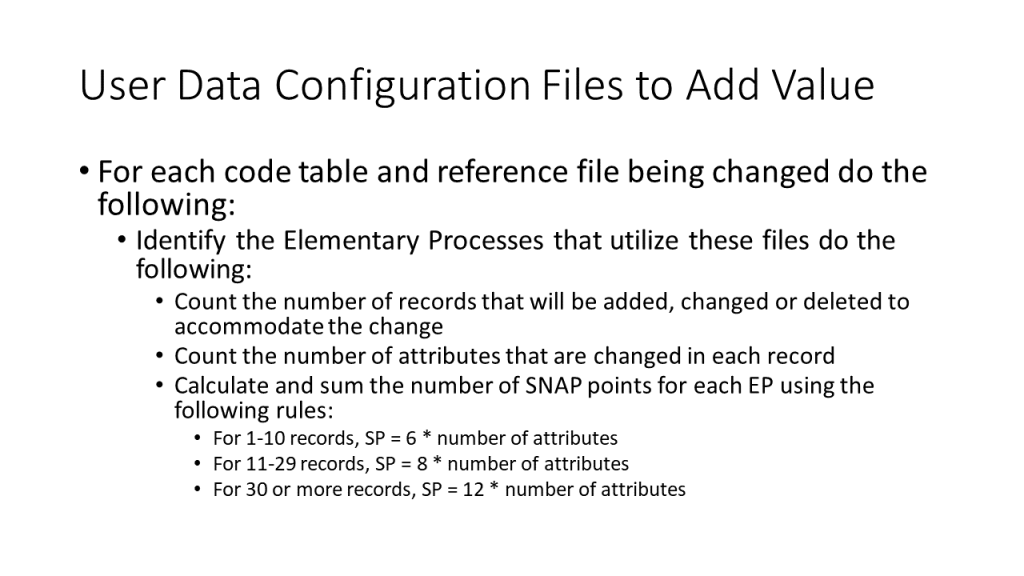
There are three items that are counted using SNAP that are not captured strictly from the elementary processes. The first is data configuration files. Counting these was explained in User Data Configuration Files to Add Value. A summary of this is:
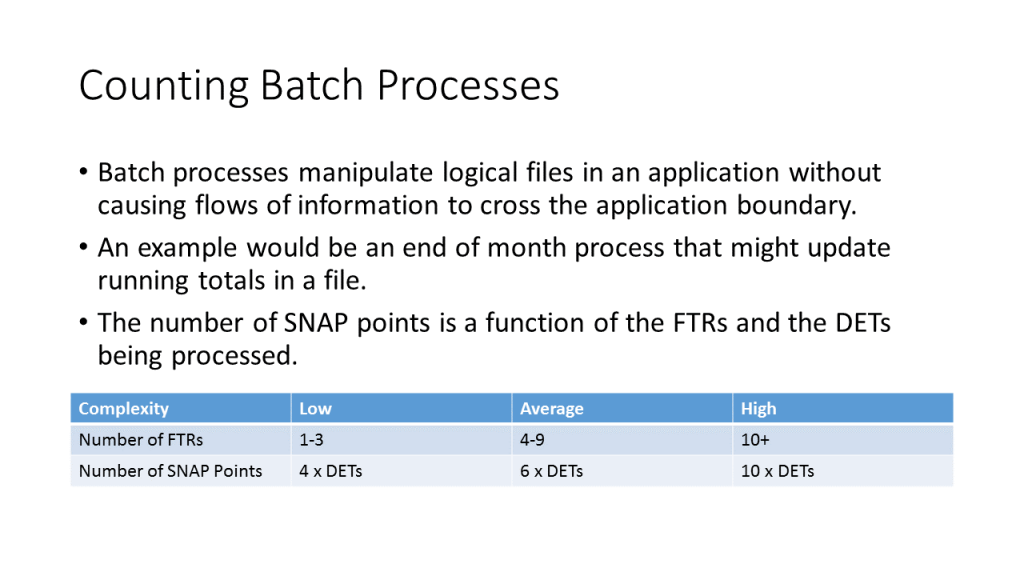
The second item is based on the number of batch files. Rules for counting these were given in Counting Batch Processes. A summary is:
The third item is based on the application’s help system. When elementary processes are added to a system, they usually have help associated with them. This was discussed in Calculating the Size of the First Release. As additional elementary processes are added to an application, more help information is added to the application. This is considered to be part of the process and is not estimated separately. When elementary processes are changed, the help information will change. Often, subsequent releases will introduce help in levels that were not provided before. For example, one release may produce a report, but a later release might introduce help that would explain how to interpret that report. Cases like these should be estimated using SNAP points. When counting SNAP points, anything that was covered by the function point count should not be considered. Here, we are not counting; we are estimating! Any time that an estimator thinks that some of the help will be a significant separate effort, it should be considered. First, enumerate the help objects. Examples of help objects would include:
- Text explaining how to interpret a report,
- Data Element Types (DETs) that might be on an input form,
- Explanations of menu item,
- Any static web page,
- A link to an explanation of a password that might occur on a “Change Password” screen,
- Text explaining the purpose of an input screen,
- A link to some other multimedia item such as a movie, or
- The text of a FAQ.
Count the number of help objects and divide by 16 to arrive at the number of SNAP points. If any of the help objects utilize a screen print, then add an additional 2 SNAP points.
Remember that some items may be beyond the scope of a software estimate. For example, if a web site for traders contains a course on how to do technical analysis of stock price movements, the effort to develop this course is best estimated using some other approach. The same might be true for a static web page. Taking some product information and putting on a web page might be comparatively simple. Developing a web page explaining a company’s mission and vision might take a long time for a start-up that has not addressed these issues yet.
Function points and SNAP points are consumer measures. They are obviously measures of size. They take a user’s point of view. A user considering an application that maintains five logical files will probably think that it is smaller than one that maintains 10. Obviously, there are other considerations. If the first application has 50 reports and the second has 10 then comparing the relative sizes becomes more difficult for a user. Projects make the situation more complicated. It is difficult to compare a project that adds a logical file and the maintenance transactions to a project that changes the format of 10 different existing transactions. The function points of one cannot be compared or added to those of the other. This situation is not particular to software. The United States Postal Service (USPS) charges for the delivery of packages based on their size. Size is a function of both weight and the dimensions of the package. However, they cannot be combined. A 12 ounce package in a 10 inch by 12 inch envelope cannot be interchanged with a 24 ounce package in a 5 inch by 6 inch envelope. The weight and dimensions are simply two different attributes that cannot be compared, interchanged or added together.
The USPS has found a way to charge for shipping that considers weight, dimensions and distance. There is no easy formula. There are tables that consider these attributes in order to arrive at a shipping price. In the case of USPS, this might also be considered a producer measure. It should be reflecting the cost that it actually takes USPS to perform this effort. Traditionally, the producer measure in software development was the Source Line of Code (SLOC). It represents the effort that developers are actually putting into the project. This is still the case except cases where there is significant amounts of screen painting and other software development that does not involve writing lines of code. Just like USPS blending weight and dimensions to calculate prices, function points and SNAP points must be blended to arrive at a size measure. This is complicated by the fact that function points are usually used to measure the size of adding new functionality while SNAP points are usually used to measure the size of changes to elementary business processes. Project size incorporates both. After reviewing projects that involved both types of functions and measures, it appears that the best blending of size would be to take function points and add .858 times the number of SNAP points to come up with a blended size.
Transforming Size into Schedule and Effort described how to do this for the first release. The approach is exactly the same except that SNAP points are added to the equations. They are summarized here.
The effort in person-months can be given by the equation RAD EFF PM = 4.46 * SIZE ^ E * Product of 21 Cost Drivers. E = .91 + .01 * Sum of 5 Scale Factors. The cost drivers and scale factors were described in Cost Drivers – Effort Multipliers and Cost Drivers – Scale Factors. The SIZE is determined by the equation SIZE = Sum for each Language Level ((Number of function points + .858 * Number of SNAP points) * Percentage of functionality implemented using languages at that level * 320 / Language Level) / 1000. Language level was described in Transforming Size into Schedule and Effort and is not repeated here.
The next thing to calculate is the calendar time that this application should require. The primary driver is the effort required. Calendar time is a function of the effort but it is not a continuous function. The equations for calendar time are different depending upon the size of the project. In this case, the project size is measured in person months of effort. The effort figure from above could have been used, but for consistency with the COCOMO suite, a quantity called PMnoSCED is used. PMnoSCED is the effort figure from above / the product of the last 5 cost drivers / 1.43. PMnoSCED is based solely on COCOMO, which uses only the first 16 cost drivers. The value of 1.43 is the extra effort that is required for rapid delivery. As far as the formula is concerned, it is the value of SCED. Once this value is determined, the calendar time is determined by one of these alternatives:
- If the project is small, based on the value of PMnoSCED being less than or equal to 16 staff months, then the number of calendar months, called RAD EFF M, is equal to 1.125 * SQRT(PMnoSCED) * product of the last 5 cost drivers. The last cost driver has a different value for schedule than for effort. In any case, this value will be of no surprise to traditional project managers. It was common wisdom to staff a project by using the square root. For example, a 9 staff month project would be performed by 3 people in 3 months. The truth is that small projects can often be planned by identifying tasks and assigning people to them. The project plan becomes the estimate.
- If the project is large, based on the value of PMnoSCED being greater than or equal to 64 staff months, then RAD EFF M is equal to 3.1 * PMnoSCED ^ (.28 + .002 * the sum of 5 scale factors) * product of the last 5 cost drivers. This is delivery time from COCOMO, post processed by the CORADMO cost drivers. This is not surprising; COCOMO was built with large projects in mind.
- If the project has a value of PMnoSCED between 16 and 64 staff months, then the number of months is based on a linear interpolation between the number of months between the delivery time for a 16 staff month project and a 64 staff month project. It is based on this value, because the result is still post processed by the CORADMO cost drivers. Without considering this post processing, a 16 staff month process will be completed in 4 calendar months. The delivery time for a 64 staff month project, a value that can be referred to as Mof64 is given by 2.75 * 64^ (.002 * sum of 5 scale factors). The delivery time for the project, RAD EFF M, is equal to 1.125 * ((M of 64 – 4) / 48 * PMnoSCED) + (4 – 16 * (Mof64 – 4) / 48)) * the product of the last 5 cost drivers.
It was described how schedule and effort predictions were mapped into a project plan in Transforming Schedule and Effort into a Plan. The second through the Nth release is done in the same way as the first. The key to understanding this process is to consider the staffing level and the project backlog. Usually, the team is staffed higher than is necessary to produce the next release. This is because, in addition to working on the next release, the team is also working to produce the MVP. Another way to look at this is from the perspective of the backlog. In the beginning, the backlog is full of items that are necessary for the MVP. Only a portion of them are addressed by any one iteration or sprint. However, the project team should be working on additional backlog items so that it is positioned to deliver the MVP after a few releases. Theoretically, the backlog will be empty when the release that produces the MVP is done. In reality, the backlog will probably contain changes that seem desirable for the application but are not necessary to incorporate into the MVP.
Leave a Reply