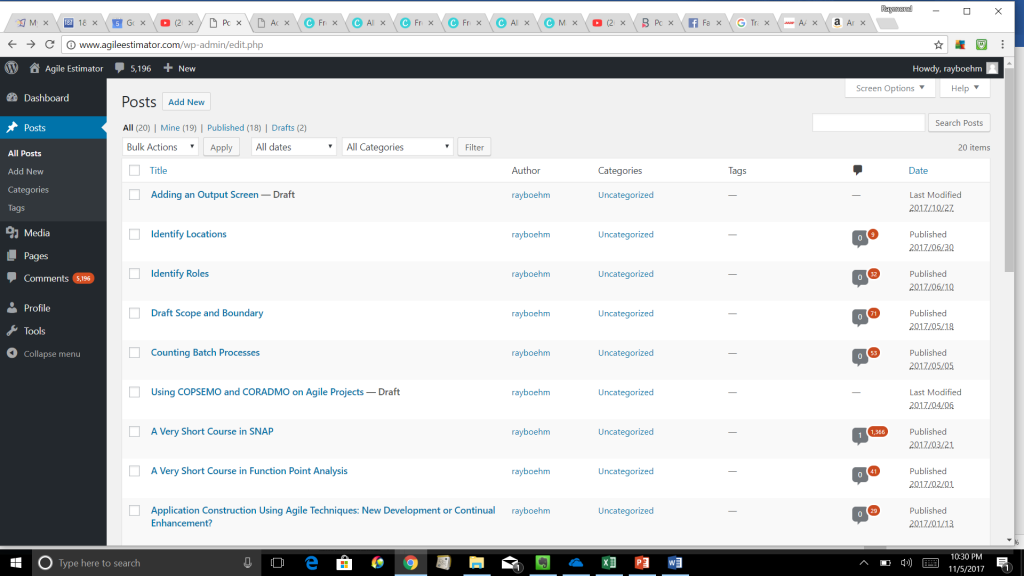
In a simple world, there would be a one-to-one correspondence between user stories, elementary processes and function point transactions. For example, “as an author, I can see a display of all of my posts.” This is an elementary process. It is also an External Output (EO), since there are values for the total number of comments. It looks like estimating is easier than we feared. However, the world of software development is seldom simple. First, the user story might not correspond to an elementary process. Some stories are simply technical, indicating that the user will be interacting with a pleasant screen. Epic stories usually correspond to several elementary processes. Unfortunately, sometimes several elementary processes are covered by the same transaction. For example, one elementary process might be to display the list above and another might be to print it for an administrator. Upon analysis, you may realize that the same data is used in both cases. It is sized as a single External Output (EO).
Most of the time, when changing an output screen. this does not become an issue. You will have already addressed these situations when you performed the Adding an Output Screen procedure. However, there are times when this may not have occurred. For example, you might be estimating the second or subsequent release of an application when the first release was done using a different or no estimating approach. Another situation where this could be happening is where you are enhancing an application that was not subjected to any function point analysis. In these cases, you will have to use the principles outlined in Adding an Output Screen to identify the function point transactions in the original application.
Once you have identified the transaction, there is a question of whether the change is a substantial functional one. Agile development teams sometimes use various types of stubbing. They may envision the output screen above. However, this is going to part of release 3. In release 2, there is simply a list of posts. In release 2, this listing could be considered a stub. When release 3 is being estimated, then the report should be estimated as if the team were Adding an Output Screen. This should be done any time the estimator feels that the team is “going back to the drawing board” to change some functionality. Note that functional changes always alter the information that is crossing the application boundary. When new Data Element Types (DETs) are added or removed, this is a functional change. Changing the way a DET is derived is a functional change, provided that a different value is calculated. Changes to the method of calculation, like to increase performance, is considered technical.
If a change is technical, or if it is a relatively small functional change, then it should be sized using Software Non-functional Assessment Process (SNAP) points. While SNAP is designed for strictly technical changes, it can be tweaked to estimate small functional changes. The procedure for doing this is described in the remainder of this post.
Theoretically, an application could be developed with no data entry validation. Input would have to be valid, or the application would not work. Therefore, most applications check to see that numbers, and dates are valid. If these validations are being added as a change, then SNAP points are counted. If they are part of a small functional change, then add the SNAP points. Every DET that is being validated should be counted. Note that this is irrelevant for most of an output screen. It is only counted if there is a selection criteria for the screen where there are input DETs that are validated.
The number of SNAP points are a function of the number of DETs for which validation is being added. If a small functional change involves the addition of a DET with validation, then add this to the SNAP points. Validations have nesting levels. For example, if an input accepts both birth and death dates, checking that the dates are valid is a nesting level of 1. If the application checks that the former occurs before the latter, then the nesting level is 2. If this were the only change, then 4 SNAP points would be added. That is 2 for low complexity (only 2 levels of nesting) times 2 DETs (birth and death dates). Nesting can get high in applications that validate addresses. The zip code must be valid for the city and state. The street address must be valid for the city.
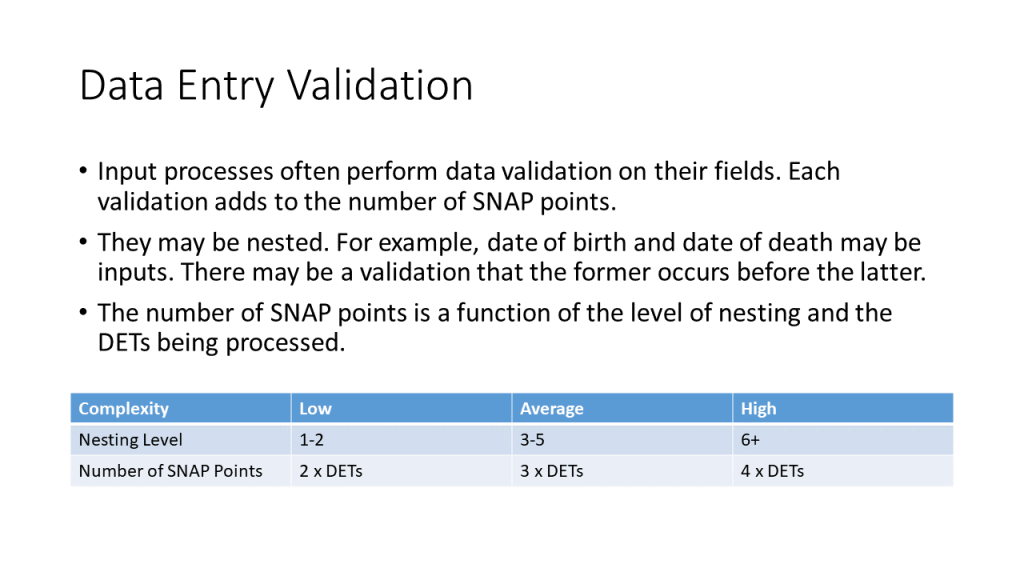
Some output screens are simply more complex than others. They take longer to develop or change. First consider logical complexity. If there are 38 DETs or more, then the output screen is logically complex. If there is logic that involves 4 or more levels of conditional testing it is also considered logically complex. If the output screen is logically complex, there is no need to check for mathematical complexity.
Mathematical complexity occurs when a output screen utilizes complex mathematical algorithms. This is typical of scientific applications. Many business applications also involve optimization, statistics, scheduling and some tax calculations.
SNAP points are a function of the number of File Types Referenced (FTRs) and DETs. If an output screen was changed to perform a regression on some of its data. If that change added 2 DETs and referenced 2 logical files, then 6 SNAP points would be counted. The 2 logical files would indicate low complexity. This would mean that 3 times the 2 DETs would be counted for the complex mathematical operation.
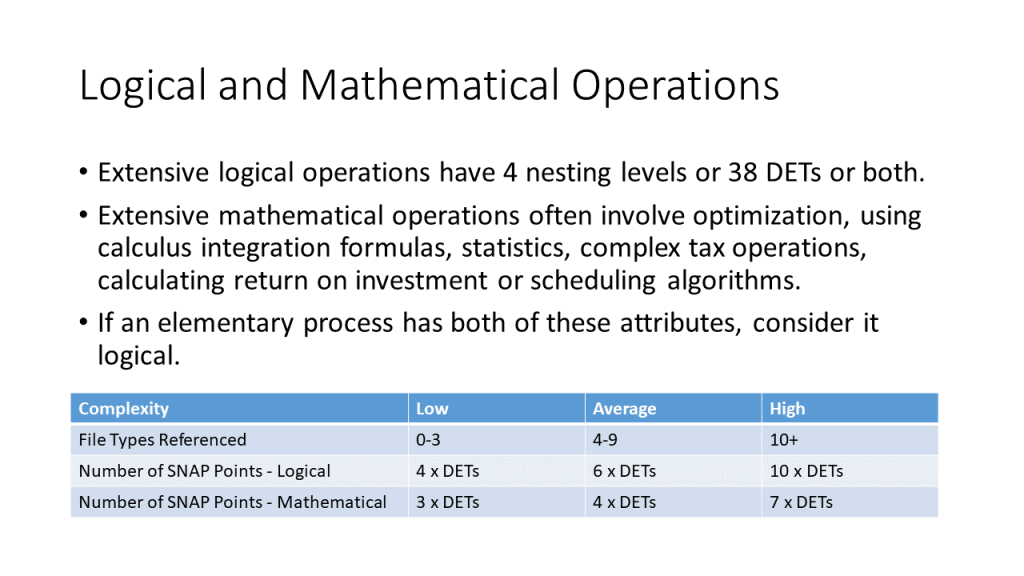
Add SNAP points if a transaction changes in regard to data formatting. This might be relevant to screens and reports. For example, if the run time on a report had been shown in Greenwich Mean Time (GMT) and was being converted to local time. It also includes transactions between applications. For example, if an application is changed so that numbers must have leading zeros. Conversion for encryption and decryption are covered here. Encryption and decryption may be done for security reasons, to save time and space (like zipping a file) or to conform to standards. Audio and video streams have a variety of encryption and decryption formats. Some industries have their own encryption/decryption standards. For example, Electronic Data Interchange (EDI) have special industry accepted formats, as do transaction that are consistent with the Health Insurance Portability and Accountability Act of 1996 (HIPAA).
Except for encryption/decryption, transformation complexity is considered low. When encryption/decryption utilizes supplied software, like an Application Program Interface (API), then it has average complexity. If developers are working from the specifications are developing from scratch, then the transformation is complex and takes longer to develop. Multiply the coefficient from the table below by the number of DETs being changed in the transaction.
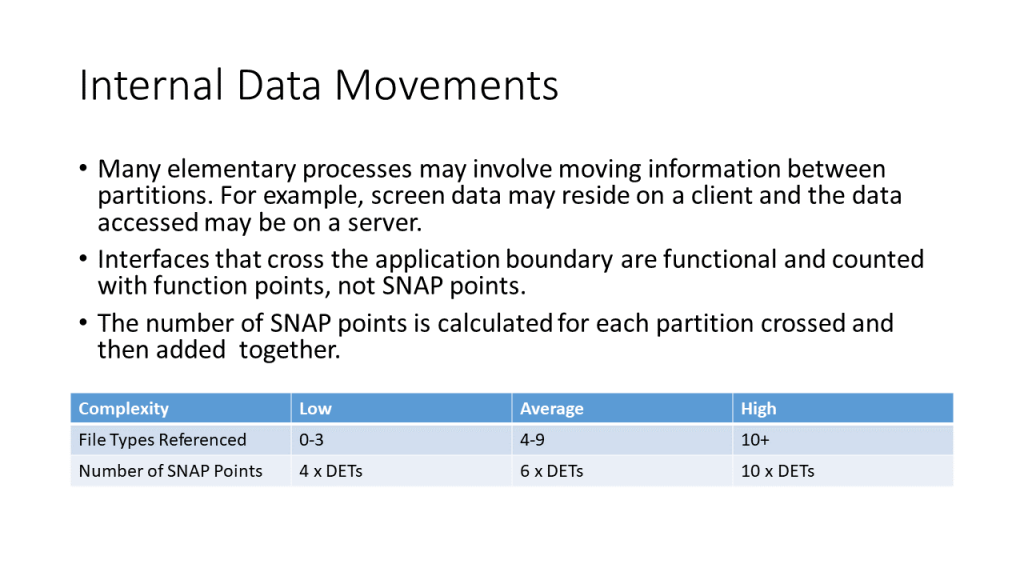
Applications often have multiple partitions. Identifying Partitions is a separate post. However, elementary processes often involve moving data between partitions. If there is a change to an elementary process that involves such data movement then add the appropriate SNAP points. For example, in a client-server application, the user interface might be on the client and the data might reside on a server. A change to an input transaction would generate SNAP points. The complexity of the change would depend upon the number of File Types Referenced (FTRs). If 3 new DETs were being added, and if they interacted with 2 logical files, then 12 SNAP points would be added. The 2 FTRs would correspond to low complexity. The number of SNAP points would be 4 (the coefficient for low complexity from the table below) times 3 DETs. If data is moving through several partitions, then count each one and add the result. For example, if screen input is moved to one partition that contains the database of record and another with contains backup data, then calculate the SNAP points for each partition crossed and add them together.
Do not confuse internal data movements with external data movements. External data movements are EIs, EOs or EQs. They measure the functionality of the application and are sized in terms of function points. Internal data movements represent the way that this functionality is delivered. It is part of the “how” of the application. They are measured in terms of SNAP points.
Changes to graphical user interfaces do not always involve a functional change. For example, if there is a drop down that is going to be replaced with 6 radio buttons, the functionality is the same. However, there is effort involved in performing this technical change. It can be sized in SNAP points. As a practical matter, even small functional changes are more accurately captured in this manner.
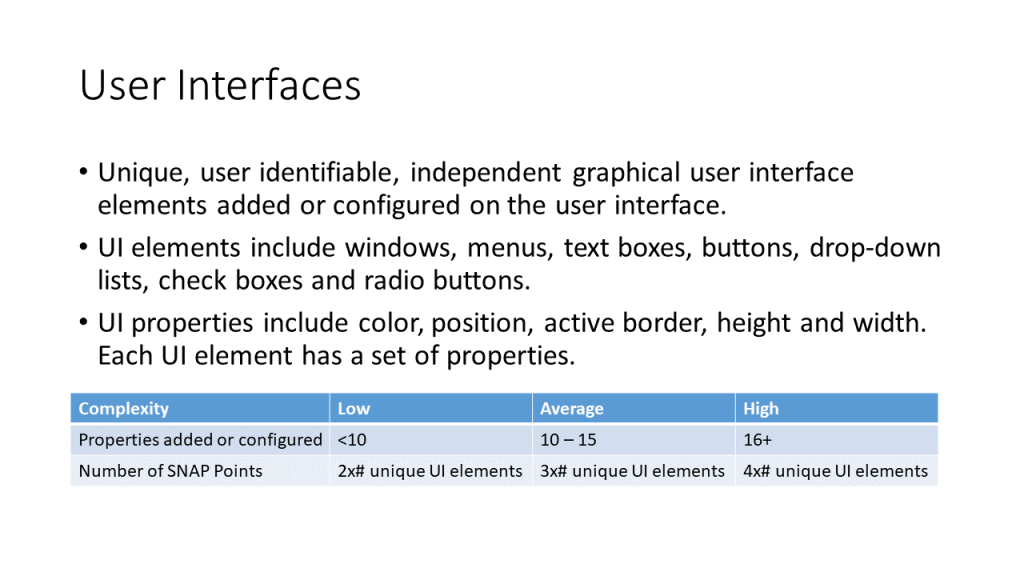
A user interface is made up of user interface elements. These include windows, menus, text boxes, buttons, drop-down lists, check boxes and radio buttons. When calculating SNAP points consider the number of unique UI elements. For example, the 6 radio buttons would correspond to 1 unique user element.
Each UI element type has a set of properties that need to be configured for that UI element. For example, radio buttons have names, a property to indicate whether it is checked, whether it is checked by default, whether it has the focus when the form is displayed and at least a dozen others. Only count the ones that are explicitly configured. Use the total number of properties across all of the UI elements to establish the complexity. Then multiply the number of unique UI elements by the coefficient found in the following table. Assuming that less than 10 properties were added or configured, the example above with the eight radio buttons would have 2 SNAP points. That would be 2 from the table times 1 unique UE element.
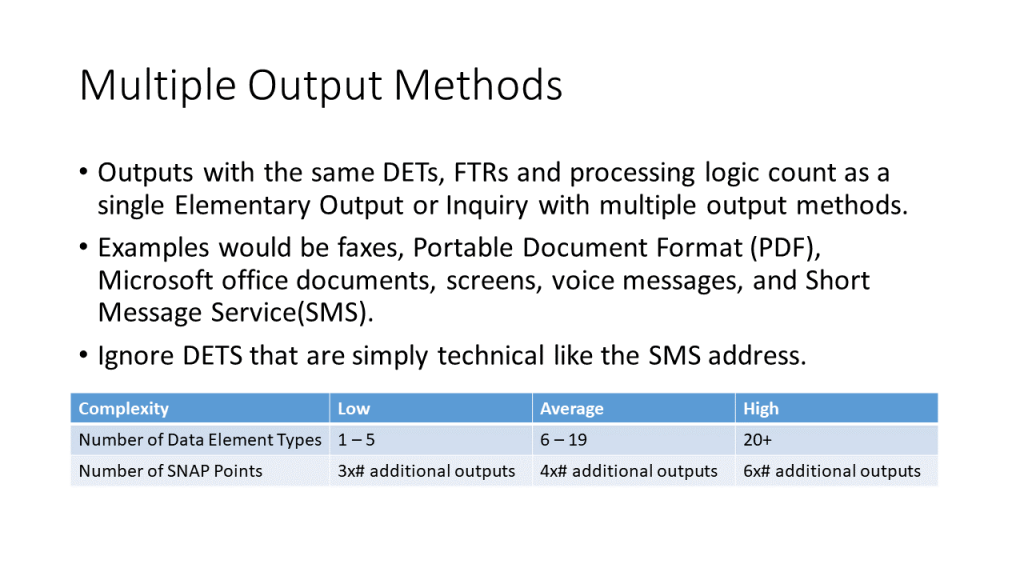
An output screen can be part of a Multiple Output Methods. If the same report can be displayed on a screen or faxed to a client, then it is only one External Inquiry (EQ) or External Output (EO), depending upon the criteria described in Adding an Output Screen. Adding or changing the fax capability would be a change to that EO and be sized in SNAP points using the matrix below.
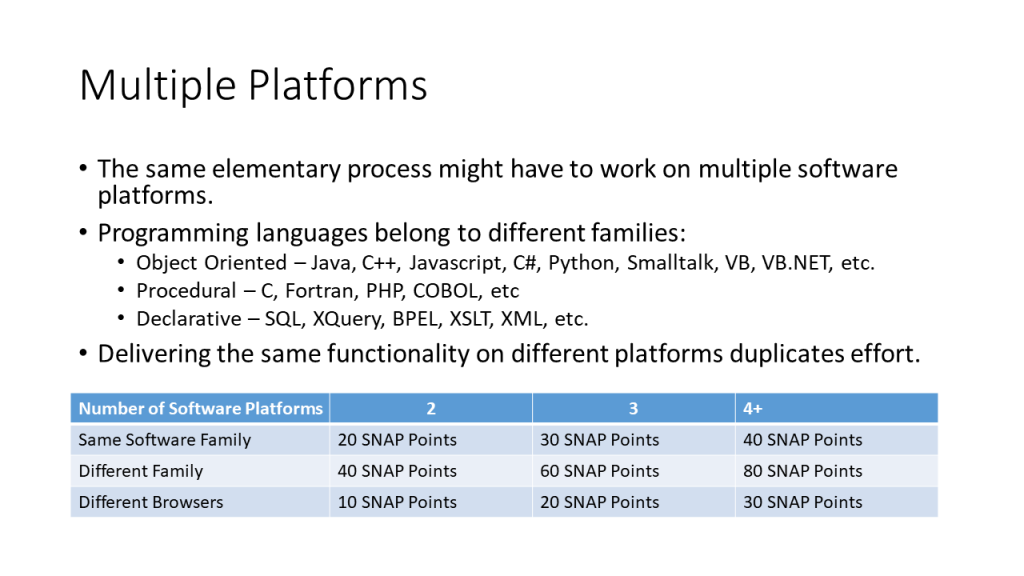
Sometimes an application must operate in several environments. For example, a web application might be required to work in both Chrome and Firefox. Usually, only a subset of the elementary processes need to do this. The forms should work in both environments, but batch jobs might run on a single platform on the server. If you are changing an output screen so that it operates on multiple platforms, then count SNAP points for sizing purposes. If different browsers are to be used, then use the table below to assign SNAP points based on the total number of browsers that must support the elementary process.
Multiple browsers is not the only place where SNAP points should be awarded for different technical environments. Suppose that you had software that was hosted onto a WordPress platform. It would probably be written in PHP. If the decision was made to also host this application under Squarespace. This code would probably be written in Javascript. These are different language families. Every changed output screen that resided on both platforms would be given an additional 40 SNAP points according to the table below.
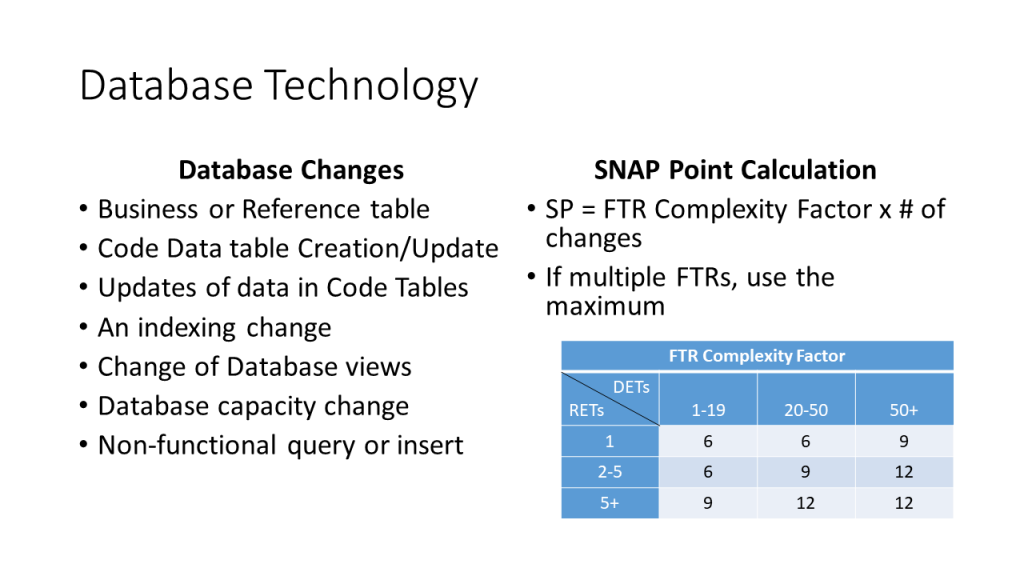
When an output screen changes, it is often associated with a change to the databases it is referencing. The types of database changes are on the left side of the slide below. Calculate the SNAP points considering each of the file type referenced (FTRs) that has changed. Use the chart on the right to establish a complexity factor based on the on the number of data element types (DETs) and record element types (RETs) of the file. For each file, calculate the SNAP points based on the number of database changes that occur. For example, if a logical file had some new fields added and the database was indexed on one of them, then it would be a two database change. If it was a low complexity file, then 12 SNAP points would be added. If several of the file types referenced change, then the SNAP points for each is calculated, but only the maximum value is added to the SNAP points for the elementary process. Also note that code tables are considered here, even though they are not counted at FTRs in a function point transaction.
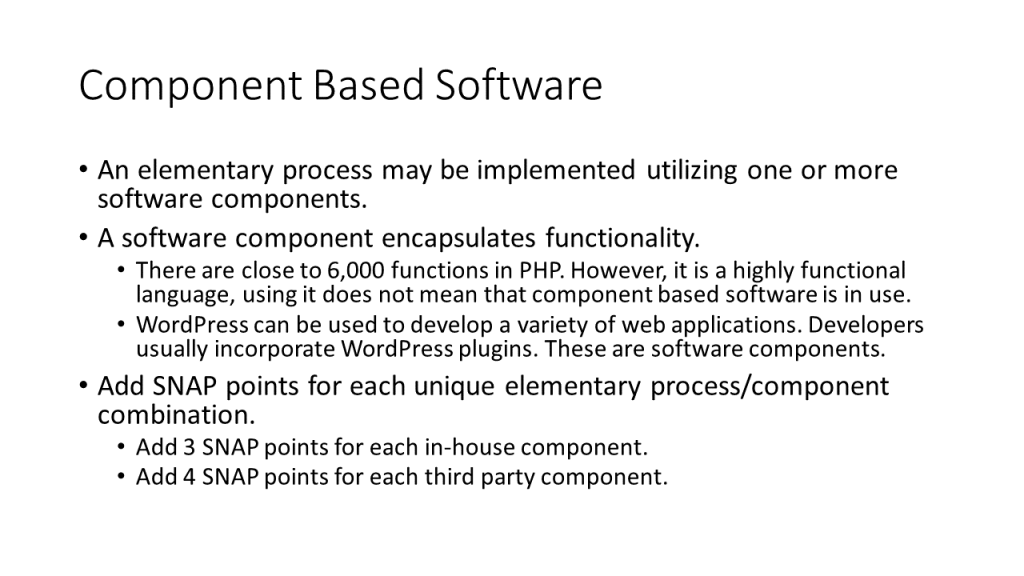
If the output screen is implemented using one or more software components, then add 3 or 4 SNAP points for each component, depending whether it is in-house developed (3 points) or third party (4 points). In-house components are often application program interfaces (APIs) that facilitate communications with other applications. Third party components are often purchased components that supply some functionality, like WordPress plugins.
Leave a Reply