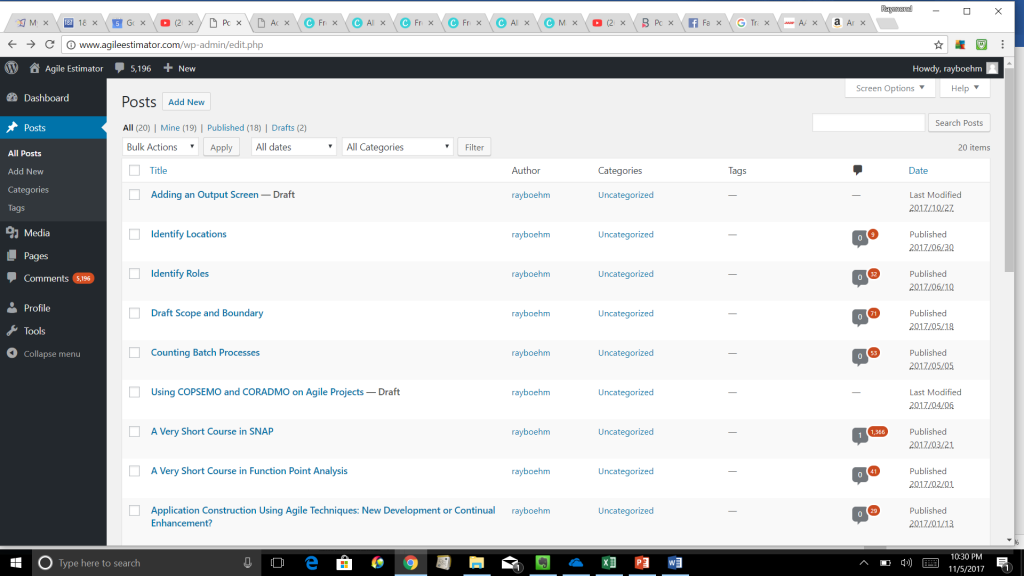
Many applications display information on screens. The example above is the WordPress screen that shows the posts that make up the blog. If we were developing the WordPress application, then adding this screen would probably be in the first release. It might be changed in future releases.
The initial user story for this might be: “As an editor, I can see a list of posts that make up the site.” Details of the listing may be supplied through conversations with the users. It is possible that there will be another initial user story that says, “As an administrator, I can see a list of posts that make up the site.” This is where a decision must be made. Will the same list be available to both editors and administrators, or will the each category of user require different information in their lists. If they are basically the same, then there is only one screen to estimate. If they are significantly different, then each screen should be estimated separately. Of course, words like “basically” and “significantly” are weasel words. (The word “significance” means something to a statistician, but for most of us, it is a weasel word.) Here is one of the many places where an estimator must use his or her judgement. When two screens are 90% the same, they are the same. There are times to be more liberal. For example, suppose there was a user story that says, “As an author, I can see a list of my posts on the site.” The output looks just like the one above, except that there is no author column. Why should there be? It would only consist of the name of the author requesting the list. Probably, a developer would write one report and have logic to omit the author’s name when it was an author requesting the report. In any case, as an estimator, I would probably consider it to be the same as the other versions of the post list. We have another example of this in the screen above. The same report can be generated for all posts, only my posts, only published post or draft posts. I would consider all of these the same post listing and only estimate one. However, there is a way to perform a search for certain post reports. This search looks right into the posts and can find all of the posts that have a string like “SCRUM Master” somewhere in the post. This is different enough that it should be estimated separately.
WordPress runs in a web browser. This is a technical decision. It is not considered in the estimate for adding the screen. None of the functionality that the web browser delivers is considered in the estimate. Why should it be? We are not developing the browser. Furthermore, we might need an estimate before we knew how we were implementing the screen. We might have developed WordPress as a stand alone Windows application. We might have written our initial user stories before that decision had been made. Something similar can be said of the Windows operating system. Its functionality is not estimated as part of our development estimate. If a window must be scrolled in order to see the entire output, this is part of the Windows functionality and is not factored into an estimate of the output screen.
On the left side of the screen is a menu. Many applications have their menus at the top of the screen. In any case, the menus are not estimated separately. A user needs to be able to see the list of posts. Something must trigger this listing to be generated. That is essentially part of the output screen. It is not estimated separately. This is consistent with the way that user stories are usually written. We would not expect to see a story like “As an editor, I must click on a menu item to generate a list of posts that make up the site” in addition to the stories already mentioned.
Once you have decided that there is a single output screen, that screen might correspond to either an External Inquiry (EQ) or an External Output (EO). It would be impossible to make that determination based on the user stories that were shown above. There are a few ways to proceed. Roberto Meli has analyzed a corpus of function point counts and determined that the most likely function point size associated with an output (when it has not been determined whether it is an EQ or an EO) is 4.6 function points. This could be used as an estimate.
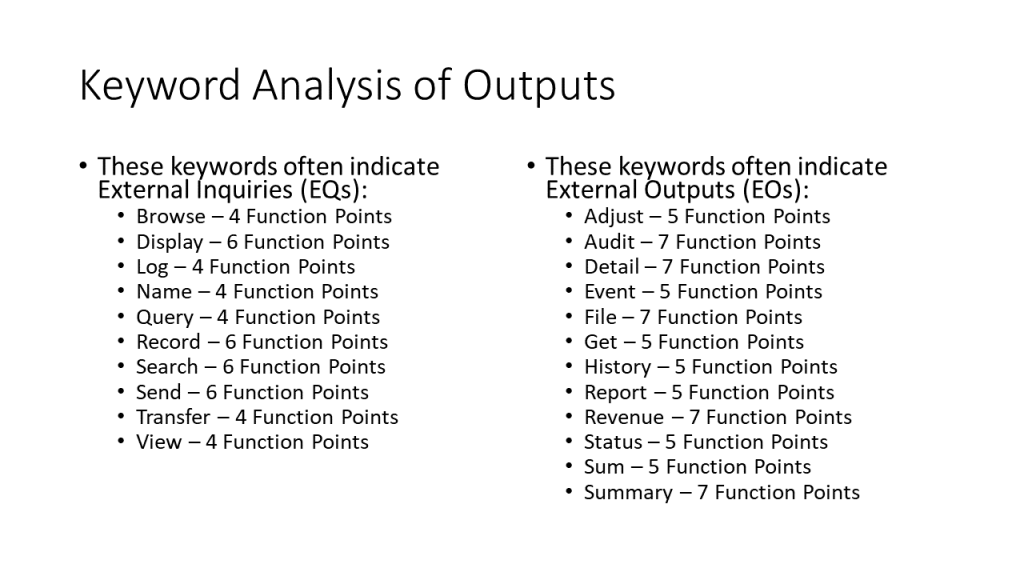
A different corpus of function point counts was subject to keyword analysis. The following slide shows the result for output transactions. When a user story contains one of these keywords, there is a good chance that it is an EQ or an EO that is the indicated number of function points in size. Use this as your estimate unless you have reason to believe otherwise.

The definitions of EQs and EOs can be used as a clue as to which type of output screen this is. If the screen reads from the logical files being maintained by the application and displays some of their content, then the screen is an External Inquiry (EQ), unless there is a complication. If there is a complication, like the screen requires calculations or writes information to a logical file, then it is an External Output (EO). The WordPress screen above is obviously an EO. Roberto Meli has found that the most likely size of an EQ is 3.9 function points; for an EO it is 5.2.
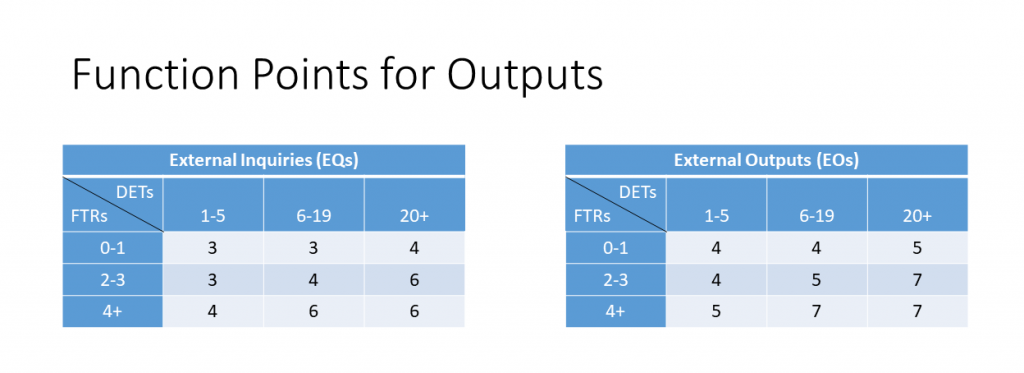
The number of function points for an output can be derived based upon the number of File Types Referenced (FTRs) and Data Element Types (DETs). FTRs is the number of logical files that are being accessed in order to display the output. It also includes any files that are written to but not read from. Part of the estimating process is to maintain a list of these logical files. Looking at the screen above, it is probable that there are two FTRs, one for posts and one for comments.
DETs are basically the fields that are displayed on the screen. There is one extra field called the action code. Even if it is not visible, it is assumed to be there. Thus, there is always at least 1 DET on an output screen. There is also a DET if the screen might generate an error message. For example, if there were a selection field to return posts that met some type of criteria, like a date range. If the user entered an invalid date, then an error message would be generated. This would be counted as a DET. If the screen generated error messages for invalid dates, invalid amounts and other invalid input, the error messages would still be considered a single DET. Each of the fields displayed on the output screen, as well as any selection criteria fields, are possible DETs. They must be unique. In other words, if the same field is displayed twice, it is only counted once. In the above screen, you can select your posts based on their category. The category is then in the display. Categories is a single DET. The same is not true of Dates and Date. The selection criteria is a month, while the actual date is displayed. These are 2 DETs. Likewise, if a set of fields are displayed for each of 12 months, it is only counted as a single DET. We have a judgement call in the above screen. There are two values for number of comments: one for number of moderated comments and one for accepted comments. I would call this 2 DETs, but someone might argue that they are both the same data type and therefore one DET. Be careful of too much consolidating or there might only be a few DETs: one for numbers, one for character strings and one for dates. This is clearly too much consolidation and would lead to bad estimates. Based on these rules, the above screen has 10 DETs: action code, dates, categories (both in selection criteria and in the results), title, author, tags, moderated comments, approved comments, date and the total number of posts displayed (21 in the illustration). The page numbers and logic involved in pagination are not counted.
EQ screens are between 3 and 6 function points; EOs are between 4 and 7. The matrices below show the how the function points are assigned. Note that the diagonal from the lower left to the upper right have the same values and they correspond to an average output. The cells on the upper left correspond to lower sized transactions, while those on the lower right correspond to higher size. The EO is 1 function point higher in each cell. In our example screen above, an EO with 2 FTRs and 10 DETs would have a function point size of 5. Remember that Roberto Meli would have estimated 4.6 function points without even deciding whether this was an EQ or an EO. Once that was decided, the estimate would have been 5.2 without counting FTRs or DETs.

It is important for estimators not to become obsessed with exact numbers for DETs and FTRs. First, it does not matter whether your DET count is any number between 6 and 19, your estimate will come out the same. In our discussion above, we questioned whether our DET count should have been 9 or 10. Either decision would yield the same estimate. When you have a FTR of 1, any DET count less than or equal to 19 will yield the same number of function points. If you are estimating schedule and effort, you are going to look at many transactions. You will then have to estimate the values for over a dozen cost drivers. If you a a product owner, you will also have to identify the most important stories to implement in the next iteration. You will be involved in other activities such as communicating with the user community. You just do not have time to obsess over DET and FTR values. Guess a little!
This shows how the above screen would have been estimated. But how does this compare to the original user story, “As an editor, I can see a list of posts that make up the site.” A user story like this would be an EQ only require 1 FTR and 2 DETs. The EQ matrix indicates that this would be 3 function points. There might be another user story that said, “As an editor, I can see how many comments were made on each post.” That would basically be the screen above that we just estimated as 5 function points. Put them together we have 8 function points. However, the 5 function point screen also delivers the functionality of the 3 function point one. A product owner could use this information to just have the 5 function point screen implemented. This would save time and money. Some estimators are like weather forecasters. They predict what is likely to happen but take no actions to change the future. A product owner can use knowledge of the application along with estimating skills to lower the size, and therefore the cost, of a release. Thus, the product owner is functioning as a member of the team.
Leave a Reply