In 2001, 17 methodologists met in Snowbird, Utah to discuss software development practices. The result was the Agile Manifesto. It stated that “We are uncovering better ways of developing software by doing it and helping others do it. Through this work, we have come to value the following:
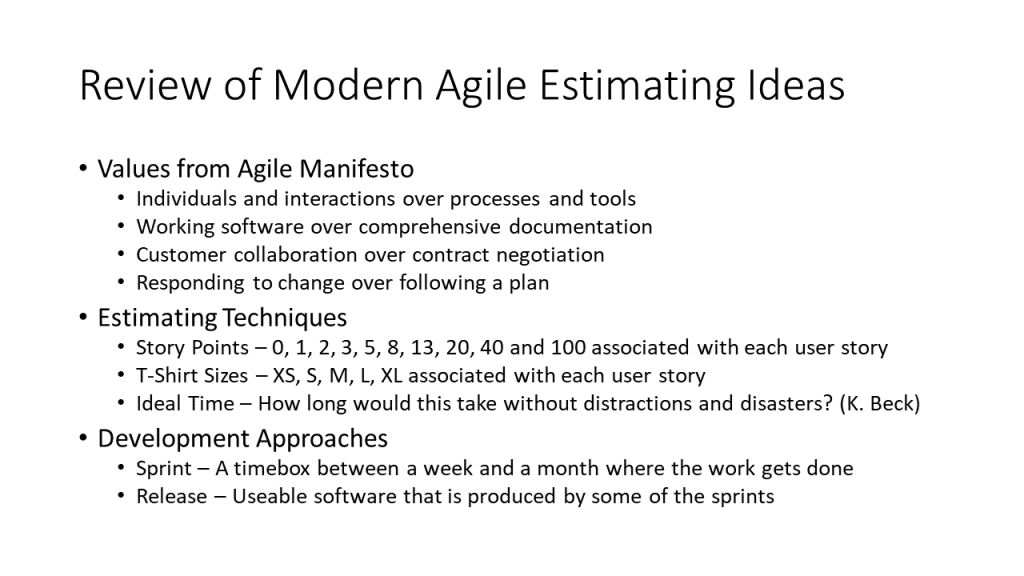
- Individuals and interactions over processes and tools
- Working software over comprehensive documentation
- Customer collaboration over contract negotiation
- Responding to change over following a plan
That is, while there is value in the items on the right, we value the items of the left more.”
The fourth value has been a source of misunderstandings between agile developers and classical estimators. After all, if you do not value following a plan, then why estimate at all? Some early agile developers believed this. They felt that if they were given a budget to start work, after a couple of iterations they would be able to estimate how much time was left. They were sure that traditional estimating techniques like function point analysis, software non-functional assessment process (SNAP) and COCOMO had no place in their agile world. To some extent, they were right. Companies experimented with agile development on low risk projects. If the project failed, it was a lesson learned. If it succeeded, it was a victory for agile development practices. More projects succeeded than failed. Agile development continued to move into the mainstream of software development. Agile teams were tasked with projects that were critical to their organizations. They were no longer low risk experimental projects. Now, organizations needed estimates of when software would be released.
Unfortunately, they could not just dust off the traditional techniques and use them like before. Some of these techniques required artifacts that would never be produced by an agile project. For example, function point counters were used to doing counts based on external design documents. These documents are never produced in an agile project. You could perform the count based on the completed release but by then, the development time would be known and an estimate would be of no value. Furthermore, the typical results for many of these classical techniques are of no value to the managers of agile projects. COCOMO normally produces an estimate assuming that the work will be done using a waterfall methodology with separate steps for analysis, design, coding, etc. It is not uncommon for estimates like 10 people for 10 months to be generated. First, there are not separate phases in an agile project. There is no analysis to generate some type of requirements document. Instead, functionality is generated with each release. Analysis, design, coding, etc. all occur at the same time. Also, no agile release should be planned for 10 months after the last. Releases come much more quickly.
In agile projects, the basis for all estimating and planning appears to be the user story. The user story is written by the customer. Traditionally, they were handwritten on cards. Most organizations now enter them into a document or a tool whose purpose is to capture and track story cards. User stories usually have a format like this example: “As an account owner, I can enter information for checks that are written.” It is not really a requirement statement because it does not specify what data is entered. However, to be a good story, it should be capable of being estimated.
One of the early estimating techniques, and one that is still common today, is the use of story points. If you have a set user stories, choose one that is about average in the amount of time you think would be required to implement it. Assign that a value of 8 story points. Now take each of the user stories and decide how long they will take relative to the 8 story point user story. Suppose the next user story looks like it will take twice as much time to implement as the 8 story point one. Multiplying 8 by 2 gives 16. However, story points must be 0, 1, 2, 3, 5, 8, 13, 20, 40 or 100. The closest number to 16 is 13; assign the new user story a value of 13 story points. Note that some practitioners use a value of 4 in place of both 3 and 5. User stories that do not get implemented as functionality, for example “as a user, my input screens are artistically pleasing” get 0 story points. Nothing gets over 100 story points. In fact, as it gets closer to the time when the 100 story point stories are to be implemented, they are often decomposed into a set of smaller user stories.
User stories are often assigned story points through a collaborative exercise called planning poker. Planning poker is played by the developers. Each developer has a set of cards with the values 0, 1, 2, etc. based on the numbers of possible story points. Someone reads a story. Everyone puts done the card that corresponds to the number of story points that they think should be assigned. If everyone agrees, the value is assigned. If there is disagreement, then the person who chose the smallest value and the one who chose the largest one should share their thought process with the group. Then the group selects values again. Some people may have been influenced by the thoughts of the people who explained their extreme values. This continues until everyone reaches a consensus regarding the number of story points. Then the same process is repeated with all of the user stories. It is critical that the planning poker session does not bog down in lengthy discussion over a single user story. If anyone on the team thinks that is happening, they should call a two minute warning to force people to compromise on a value by the end of the two minutes. Planning poker can be played with physical cards and the team gathered together in one place. There is a web site at planningpoker.com where there is a virtual version of the technique.
When it comes to T-shirt sizes, the agile community is in complete agreement that XS < S < M < L < XL. Some practitioners only use S, M, and L. In any case, they are similar to story points in that they are relative. They are used to compare the estimated work to implement user stories. However, with story points, the relationships are explicit. For example, it should take 4 times as long to implement an 8 story point user story than to implement a 2 story point one. There is no such generally accepted relationship between a small and a medium t-shirt size story. Some practitioners use both T-shirt sizes and story points. They use T-shirt sizes on epic stories that may be implemented over several sprints. Later, before they begin to delegate these stories to sprints, they decompose them into smaller stories which they estimate with story points.
Kent Beck introduced the eXtreme Programming methodology. This was probably the first popular agile methodology. He introduced ideal time as the estimating measure. He defined asking the question, “how long would this take without distractions and disasters?” Developers that are new to a team, technology or problem domain might spend a week to deliver 8 hours of ideal time because of learning curve considerations. Beck would say they had a loading factor of 5. Even experienced developers usually have a loading factor of 2 because they are involved in meetings and spending time coaching less experienced developers. When a 5 person agile team knows they have 100 ideal hours of work left, they know that they will have trouble finishing up in two weeks. When management hears the same thing, they expect everything to be done next week. Any gap between ideal time and calendar time can be made up with some unpaid overtime. It’s part of being a professional!
It should be emphasized that story points, t-shirt sizes and ideal time are actually generating estimates for a particular team to implement user stories. They will be irrelevant for other teams. Each team has different capabilities. Another team may take much longer or be much quicker. Of course, some teams may be poor at estimating.
The actual work of software development is done in a series of iterations. In scrum, they are called sprints. During each iteration, some number of user stories are implemented. These iterations are usually between 1 and 4 weeks. The iteration length is usually set by the organization. If a software development organization is running 6 agile projects, they will all be doing iterations of the same length. They are time boxes. They usually involve the whole team. Thus if you have a 5 person team doing a 2 week iteration, it will take 10 person weeks over a two calendar week period. This is not an estimate, it is an exact number. In agile development, the team members are urged to limit overtime. In fact, they are forbidden to work overtime 2 weeks in a row. The amount of functionality that is implemented during an iteration is estimated based on the number of story points or ideal time. T-shirt sizes are difficult to use because it is hard to mix the non-numeric sizes like small and large to come up with a velocity. If the previous iteration implemented 50 story points, then the next iteration should do the same. However, if the iteration does not achieve this, then it stops when the time box is completed. Likewise, if the work is done early, then additional user stories are worked on.
Releases are working software that the end users will use. Some of the iterations will result in a release. According to the agile principles, new releases should be generated every “couple of weeks to a couple of months.” Estimating when this will happen can sometimes be done tracking the velocity of iterations using story points or ideal time. Then the number of iterations required to implement the user stories in the release can be predicted. However, this approach has not always been sufficient. In those cases, semiclassical estimating has been necessary.
Leave a Reply